A team of experts at Freies Deutsches Hochstift collected data on the whereabouts of Romanticism’s most important protagonists in an extensive research project. The results are remarkable – but not easy grasp for the public. As part of the permanent exhibition, we turned the wealth of information into an interactive exhibit that allows specific research as well as curious exploration.
A cultural elite on the move
Historical data made accessible
Over the course of two years, a research team worked on retracing the life journeys of 46 Romanticists – from Johann Wolfgang von Goethe to Bettine Brentano. By meticulously collecting and evaluating letters, journals, receipts, border documents, registration forms and certificates, a huge database formed. It allows to not only (more or less precicesely) pin down the position of any of these 46 people on any given date, but also link it to encounters or experiences reflected in their work.
When we first partnered with the Freies Deutsches Hochstift to create the new German Romantic Museum, it was clear that this research project would be made a center piece of the permanent exhibition. In an intensive process of exchange and consulting, we came up with a concept transforming the database into an interactive experience accessible and useful for all visitors – from fellow researchers to school children.
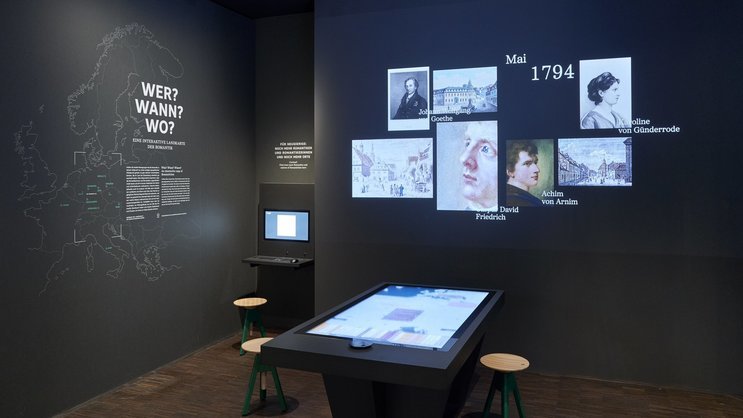
For this media station especially, we had to deeply understand the subject matter, the structure of data and the research process. Starting off from an extensive yet rather one-dimensional excel sheet, we developed a logic matching names, dates and places as uniform output. Edge cases or missing data are dealt with automatically and transparently.
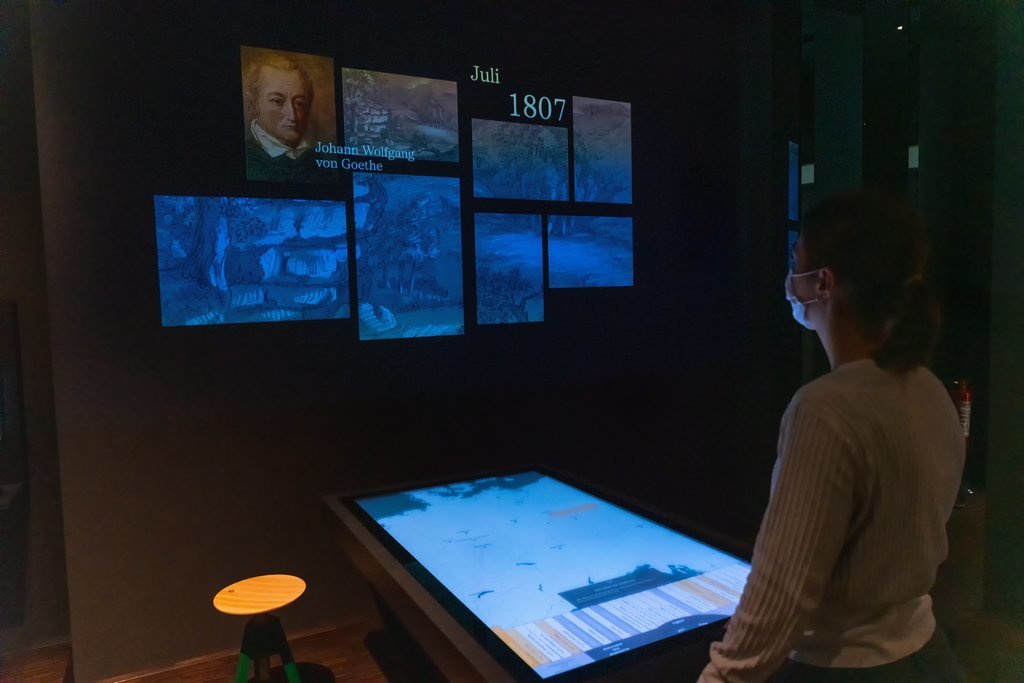
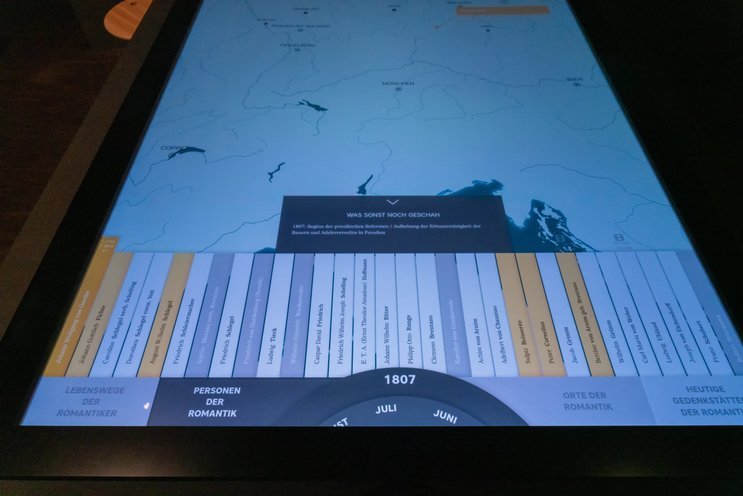
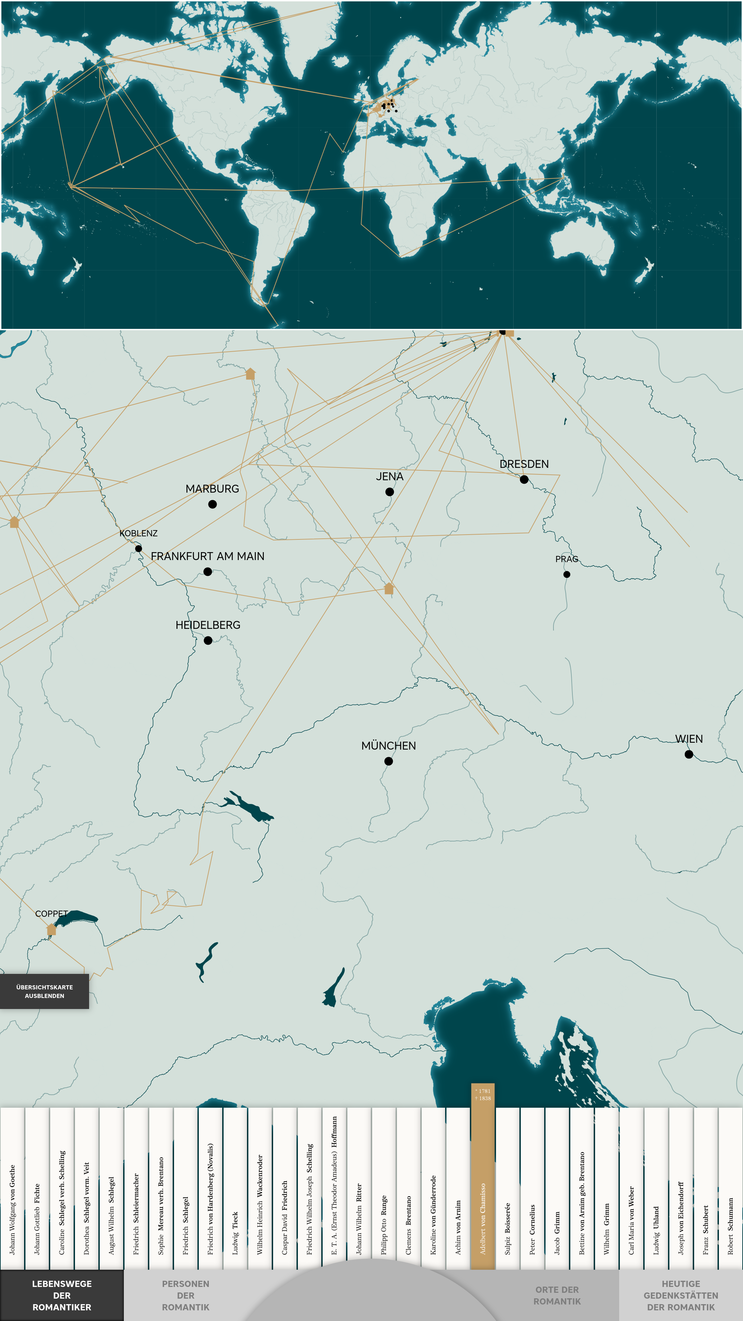
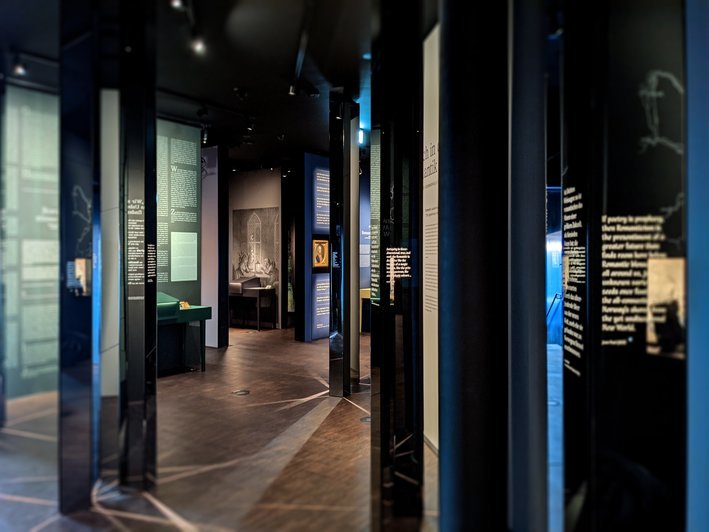
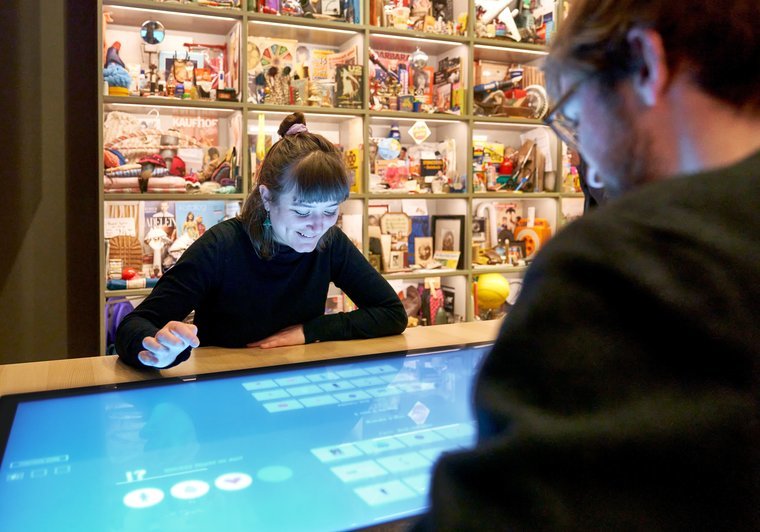
The heart of the installation is a large-scale monitor integrated into a custom table. With a clear UX design approach, we managed to organize the wealth of information and functions into structured interface elements. The idlemode explains the individual options and modes.
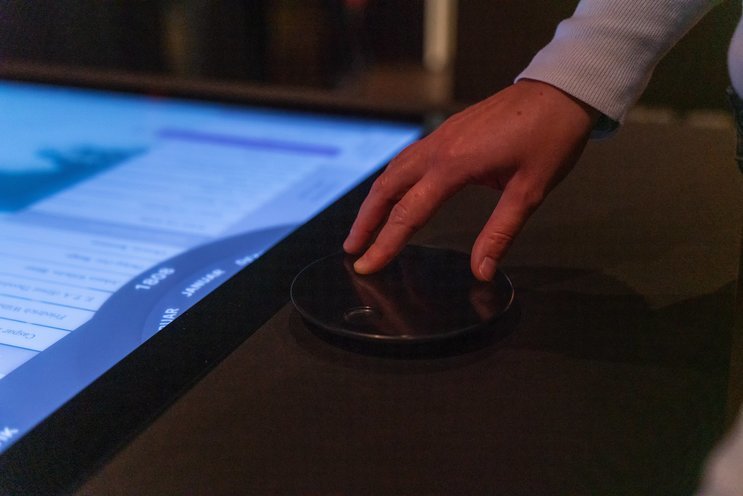
An analog rotary knob complements the touch interface of the screen. This central interaction element serves as a time machine, transporting visitors month by month through the era over the course of more than 130 years.
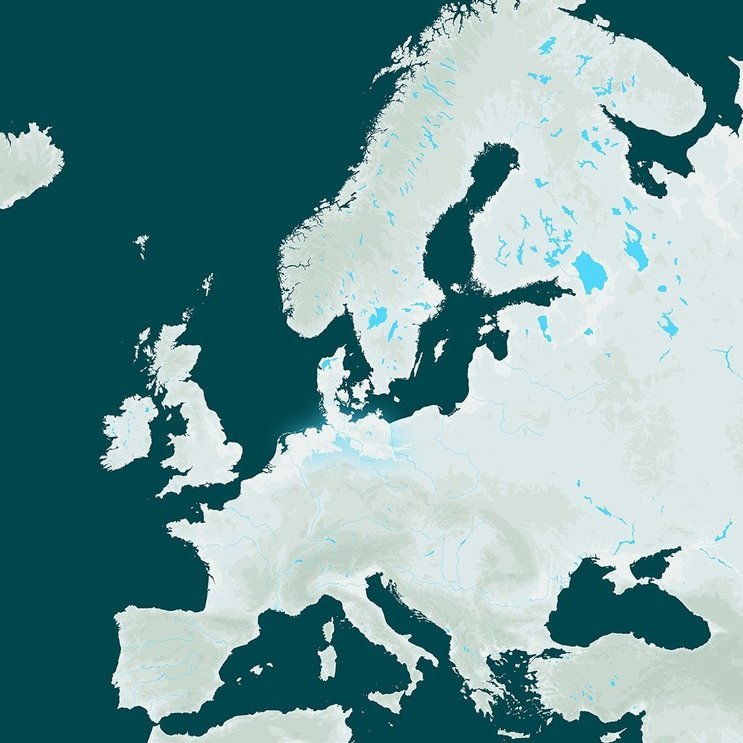
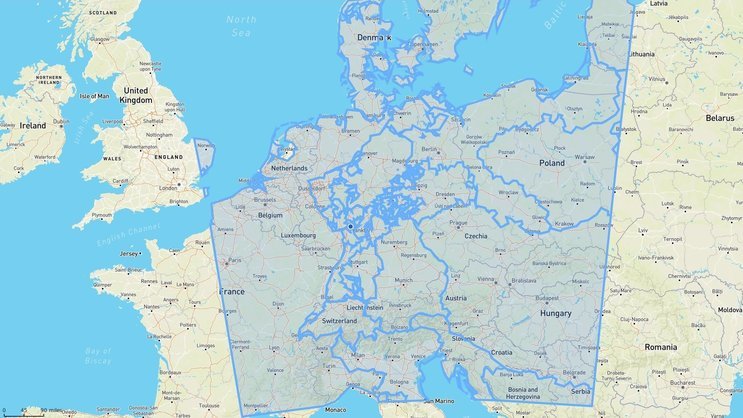
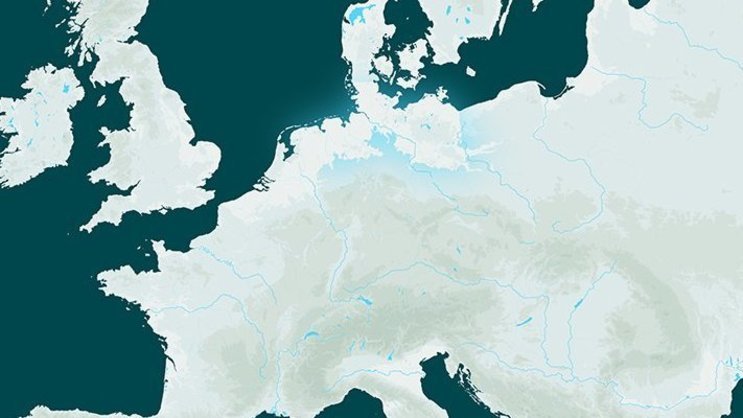
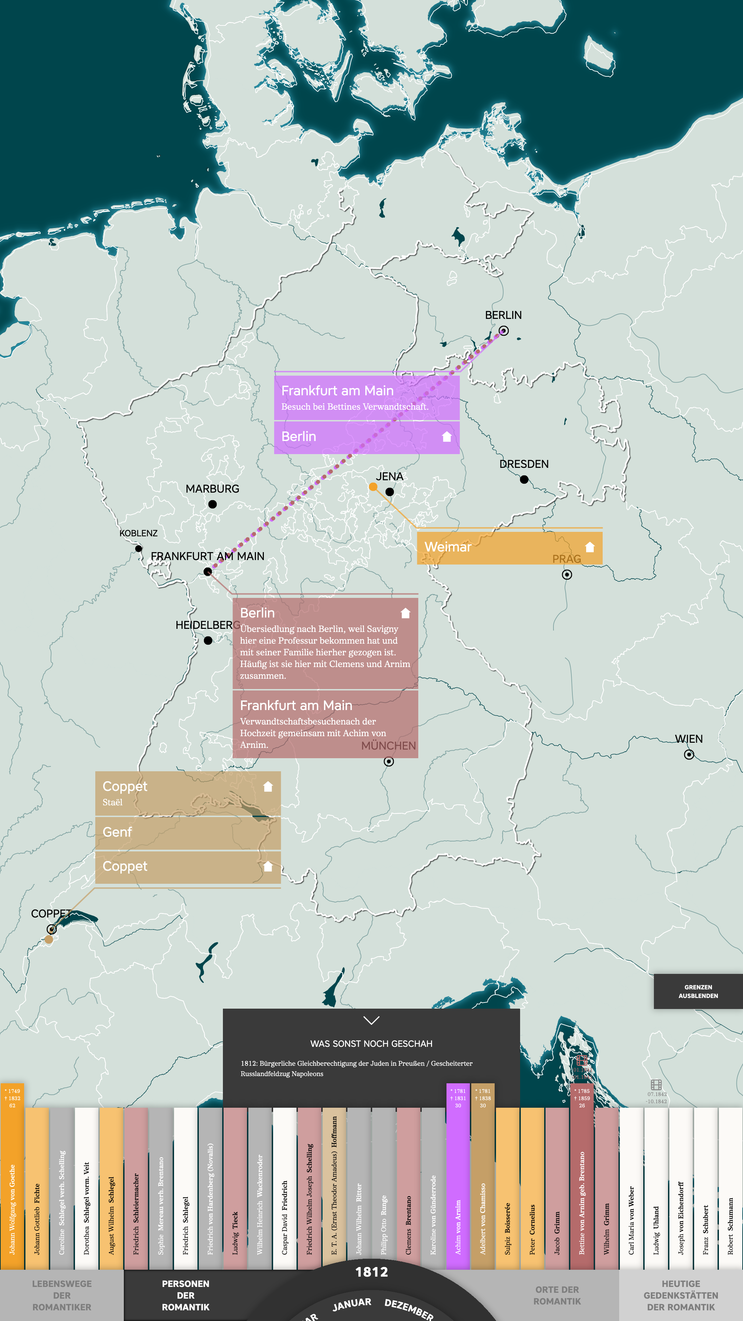
The whole exhibit has a very visual focus to include all user groups. A world map serves as the playing field for all information and interaction. To achieve maximum flexibility in handling and design, we created custom map tiles that gave us the freedom to control colors, layers of information and zoom levels.
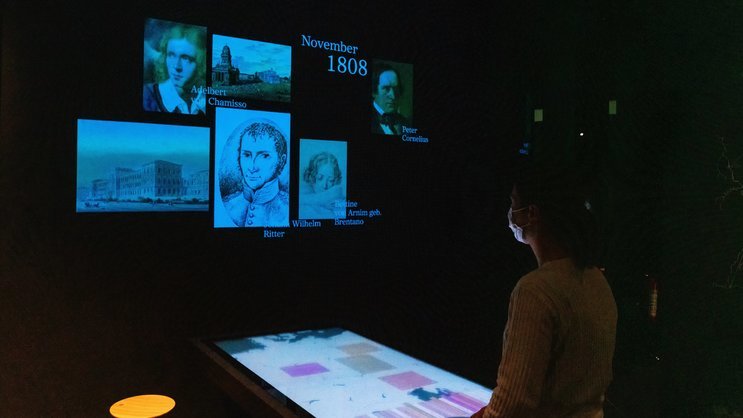
To achieve an effect from afar and create space for illustrative elements, we added a large-scale wall projection to the exhibit. With a consistent layout of portrait and landscape format projection areas, a collage of imagery appears and reacts without delay to user interaction. This way, whatever information is displayed on the touchscreen gets complemented by fitting pictures and additional information.
Every mode a different focus
enabling exploration
To sort and categorize the wealth of information at hand, we established four different modes to select from. Depending on their prior knowledge and interests, every visitor can choose the perspective they want to explore the era from.
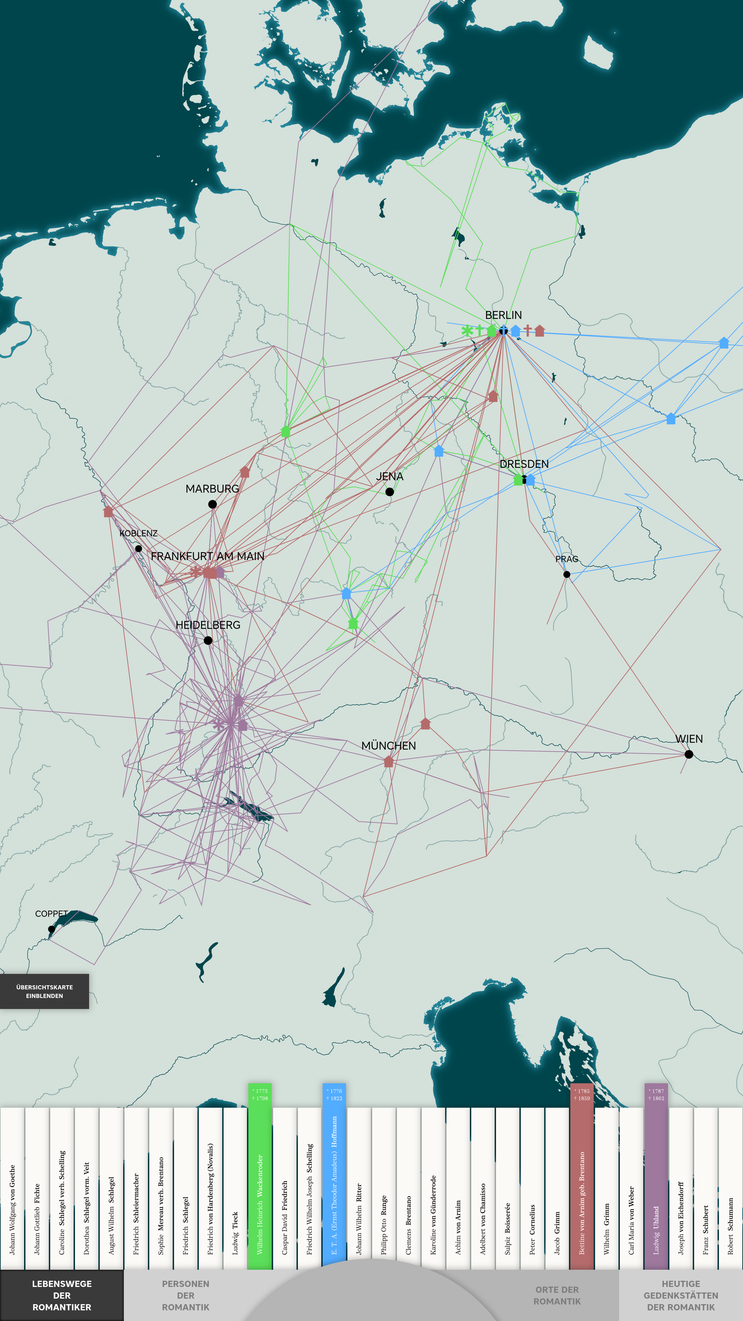
Paths
This mode shows the life journey from birth to death of up to four people simultaneously. It gives an initial overview and impressively demonstrates how settled some protagonists were and how restless and fond of travelling others.
Persons
To explore a life in detail, this mode lets visitors scroll through the whole era using the rotary knob. The protagonists selected can be traced day to day. Their location is complemented by information on the reason for their stay wherever known. As many of the protagonists were tied by kin- oder friendship, the exhibit suggests who to select additionally to find out about meetings or mutual places of residence.
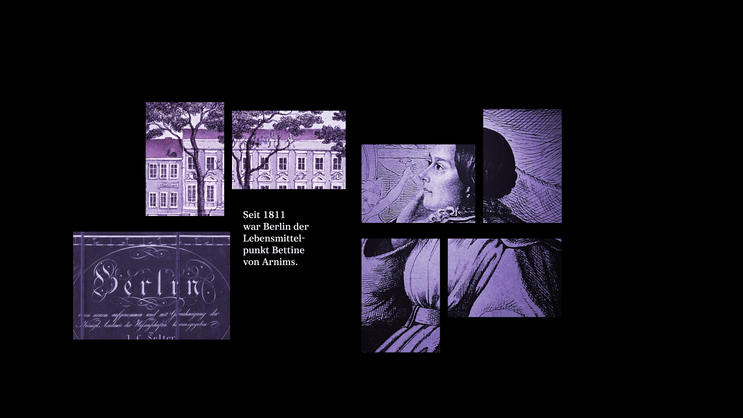
The famous trips of two protagonists are paid tribute with short films by artist Stefan Matlik. As soon as visitors enter the time period of the trip while having the person selected, the film is automatically played within the projection layout.
locations
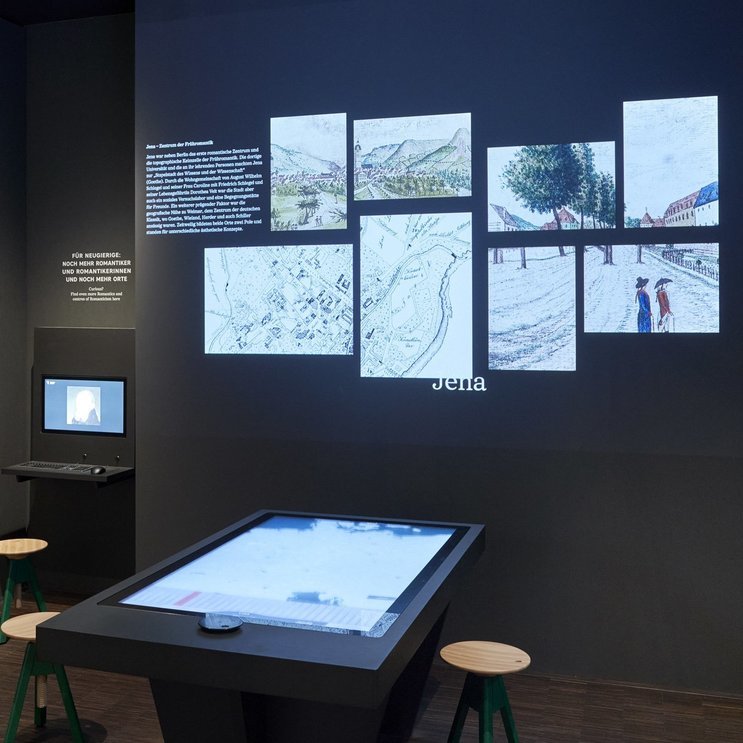
As part of the reserach project, the expert team identified cities that could be considered “centers of Romanticism” for a certain period of time by tracing the number of protagonists gathering in the same cities and then leaving them again to move somewhere else. We applied those numbers to the application and visualized them on the digital map. The locations mode highlights centers of Romanticism while users scroll through the years. A link to the persons mode allows switching seemlessly to the protagnists present and the motivation and period of their stay.
memorials
Today, Germany is scattered with places that pay tribute to the epoch of Romanticism, its works and its artists. A special mode transports visitors back to the present and lets them explore museums, archives or former residences in pictures and text. The protagonists connected to every memorial are highlighted when selected, so a direct link back to the persons mode exists.
Making-of
web-based technology stack
The exhibit presented us with a number of complex individual challenges. To turn the database of information and imagery into a smoothly running experience, we combined a number of technology solutions in one consistent software concept.
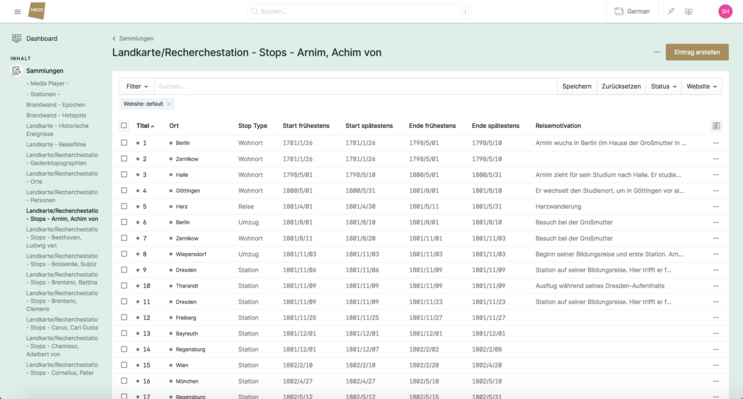
To allow our client long-term and independent maintenence of the content, we connected the Interactive Map to a customized CMS based on statamic. With a clear structure and a number of special features, editors without coding knowledge can make changes, updates and additions.
For creating and styling the custom map tiles we used the Open Source Geographic Information System QGIS and made them accesible via TileServerGL. With the Java Script library leafletjs, we turned the static tiles into an interactive interface and could dynamically translate geodata to screen coordinates.
The whole app was coded in web technology. nw.js allows us to start and control the app on the host computer – also remotely.
For interface elements, we based all code on the Java Script library react and combined it with redux for data management and framer motion for animations.
Related Projects
Curious about our approach? Feel free to get in touch!
Sebastian Oschatz Partner +49 69 24 000 321 sebastian.oschatz@meso.design sebastian.oschatz@meso.design +49 69 24 000 321
MESO Digital Interiors GmbH
Gutleutstr. 96 . 60329 Frankfurt . Germany
Team
Bettina Braun, Susanne Heinlein, Daniel Maaz, Anna Rack, Marcus Schreiter, Ben Schiek, Timon Skerutsch, Christian Struwe
